Parameterization of Li-ion battery
Measured and calculated the parameters used in a psudo-two dimensional (P2D) model, a physics-based battery model.
This project aims to experimentally obtain the parameters of a graphite-NMC622 cell for a P2D model.
Background
Pseudo-two dimensional (P2D) model is a continuous model to describe the electrochemistry and transport of a battery, especially used in lithium ion batteries. To predict the battery performance by P2D model, there are multiple parameters needed in the model, such as electrode thickness, conductivity and so forth.
Methods
Overview. The parameters used in P2D model are measured or calculated by the methods below.
| Symbol | Description | Methods |
|---|---|---|
| Negative electrode (graphite) | ||
| \(L_{neg}\) | Negative electrode thickness | Micrometer |
| \(r_{p,neg}\) | Particle radius | From manufacturer / Mercury intrusion |
| \(\varepsilon_{s,neg}\) | Solid material volume fraction | Micrometer / Mercury intrusion |
| \(a_{s,neg}\) | Active surface area per unit electrode volume | Assuming sphere (\(3\varepsilon_{s,pos}/r_{p,pos}\)) / Mercury intrusion |
| \(p_{neg}\) | Bruggeman porosity exponent | From literature |
| \(\kappa_{s,neg}\) | solid conductivity | Four-probe method |
| \(D_{s,neg}\) | Diffusivity of graphite | GITT / EIS |
| \(i_{0,neg}\) | Exchange current density | EIS |
| \(A_{neg}\) | Electrode area (negative area is dominating the cell) | From cutting machine |
| Positive electrode (NMC622) | ||
| \(L_{pos}\) | Positive electrode thickness | Micrometer |
| \(r_{p,pos}\) | Particle radius | From manufacturer / Mercury intrusion |
| \(\varepsilon_{s,pos}\) | Solid material volume fraction | Micrometer / Mercury intrusion |
| \(a_{s,pos}\) | Active surface area per unit electrode volume | Assuming sphere (\(3\varepsilon_{s,pos}/r_{p,pos}\)) / Mercury intrusion |
| \(p_{pos}\) | Bruggeman porosity exponent | From literature |
| \(\kappa_{s,pos}\) | solid conductivity | Four-probe method |
| \(D_{s,pos}\) | Diffusivity of graphite | GITT / EIS |
| \(i_{0,pos}\) | Exchange current density | EIS |
| Others | ||
| \(\kappa_{e}\) | Electrolyte conductivity | From manufacturer / From literature / Conductivity Meter |
| \(L_{sep}\) | Separator thickness | From manufacturer / Micrometer |
| \(\varepsilon_{e,sep}\) | Electrolyte volume fraction in separator | From manufacturer |
Micrometer. We can use the micrometer to measure the thickness \(L_{neg}\), \(L_{pos}\) and \(L_{sep}\). Then we calculate the porosity by (taking negative electrode as an example)
\[\varepsilon_{s,neg}=\frac{V_{dense}}{V_{total}}=\frac{\frac{m_{graphite}}{\rho_{graphite}}+\frac{m_{PVDF}}{\rho_{PVDF}}+\frac{m_{carbon}}{\rho_{carbon}}}{A_{neg}L_{neg}}\]where the dense density values \(\rho_{graphite}\), \(\rho_{PVDF}\), and \(\rho_{carbon}\) can be found in literature or from manufacturer.
Mercury intrusion. Mercury intrusion, or mercury intrusion porosimetry (MIP), is a powerful technique to evaluate the porosity, pore size distribution and particle size distribution of materials. Mercury is squeezed into the material under pressure. Due to the surface tension, the amount of intruded mercury is related to its pressure. The pressure of mercury increases from atmosphere pressure to 60000 psi (413 MPa) above the atmosphere pressure.

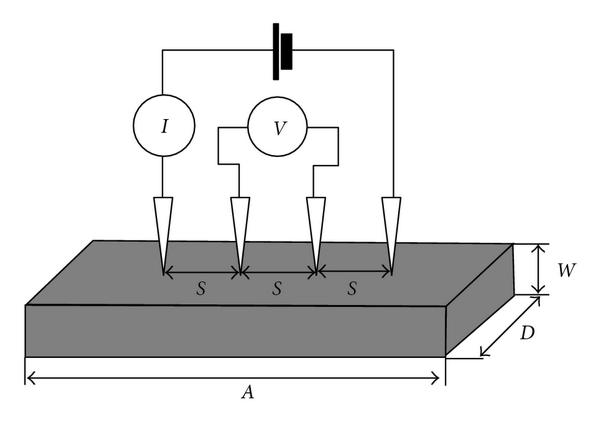
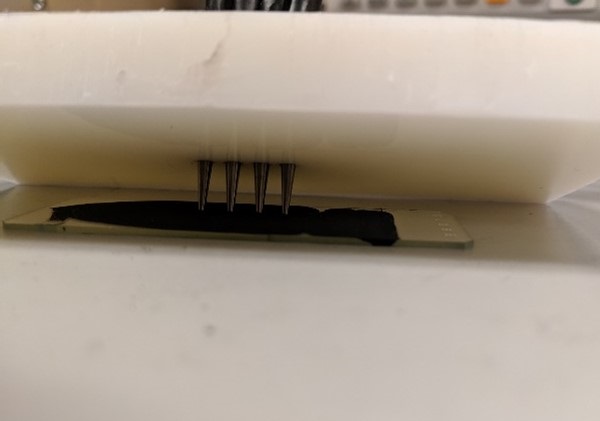
Four-probe method. The electrode conductivity can be measured by the four-point method: applying a DC current to the electrode film and measure the voltage between them. Finite element method is then used to help process the current-voltage data to determine the conductivity of electrodes. Specifically, we can measure the effective conductivity by the following steps:
- Paste electrode slurry on a glass substrate
- Measure resistance (current goes through probes at both ends, measure the voltage between center probes)
- Measure dimensions (thickness, probe distance, etc.)
- Calculate conductivity by the finite element method


GITT. Galvanostatic Intermittent Titration Technique (GITT) is a mature method to measure diffusivity. A current pulse is applied to the cell and diffusivity is calculated from the slope of voltage response versus square root of time,
\[D=\frac{4}{\pi}\left(\frac{IV_M}{SF}\right)^2\left[\left(\frac{\mathrm{d\ }U}{\mathrm{d\ }\delta}\right)/\left(\frac{\mathrm{d\ }V}{\mathrm{d\ }\sqrt{t}}\right)\right],\]where, \(I\) denotes the total current, \(S\) is the total surface area, \(V\) is cell voltage after current pulse as a function of time \(t\), \(V_M\) is the molar volume of the sample, \(\frac{\mathrm{d\ }U}{\mathrm{d\ }\delta}\) denotes the derivative of the open circuit voltage with respect to stoichiometry number. \(U^0\) as a function of \(\delta\) can be measured from the voltage at each steady state (i.e. lithium ion concentration is uniform in the particle) of a half-cell during the rest period between pulses.
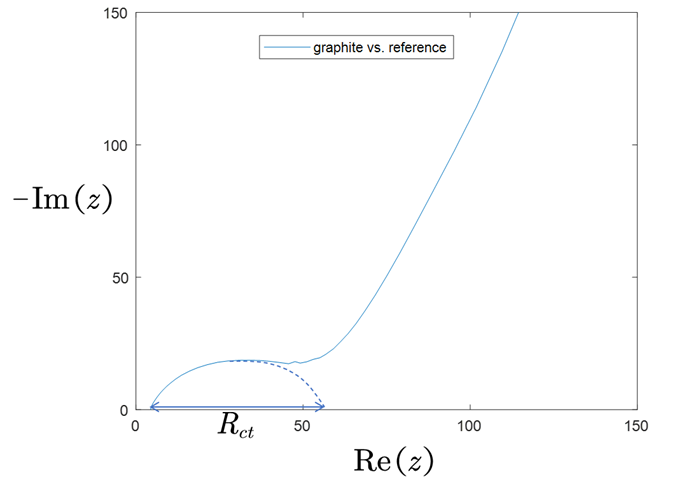
EIS. Electrochemical Impedance Spectroscopy (EIS) is an electrochemical technique to characterize the performance of cells. The cell is connected to an alternating current (AC) source and the impedance is measured as a function of current frequency. It can measure exchange current density \(i_0\) and diffusivity \(D\). Exchange current density \(i_0\) is measured by
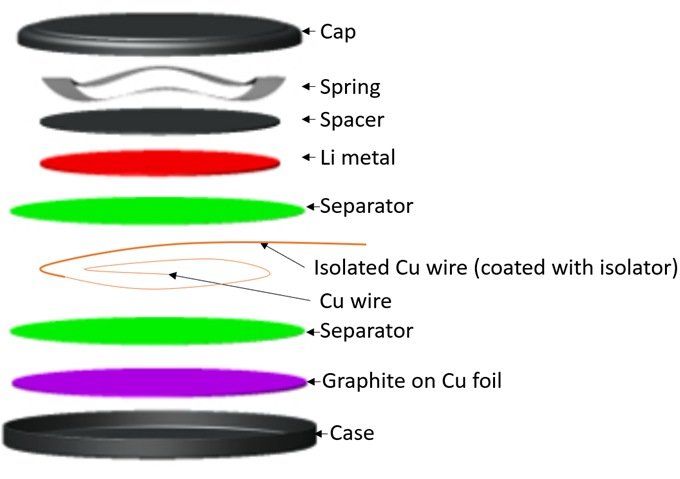
\[i_0=\frac{R_{ct}SRT}{F}\]where \(R_{ct}\) is is the charge transfer resistance, \(F\) is Faraday constant, \(R\) is gas constant, \(S\) is the surface area of particles, and \(T\) is temperature. We assembled a three-electrode cell for EIS (left below) and obtain the plot (right below).


To get the diffusivity, we use the formula
\[D=\frac{1}{2}\left( \frac{\text{d}U^0}{\text{d}\delta}\frac{V_M}{SF} \right) ^2\left( \frac{\text{dRe}\left( Z \right)}{\text{d}\sqrt{1/\omega}} \right) ^{-2}.\]where \(Z\) denotes impedence, \(\omega\) denotes frequency.
Related publications
All details are written as an internal report (for our sponsor). It is not published but may be shared upon request.